Examples of Digital Data: Sound and Image
As we have seen, data can be digital or analogue—but only digital data can be processed by a computer.
Let's look at two specific examples, namely digital representations of sound and image. What does this actually look like in a computer?
Sound: From analogue to digital


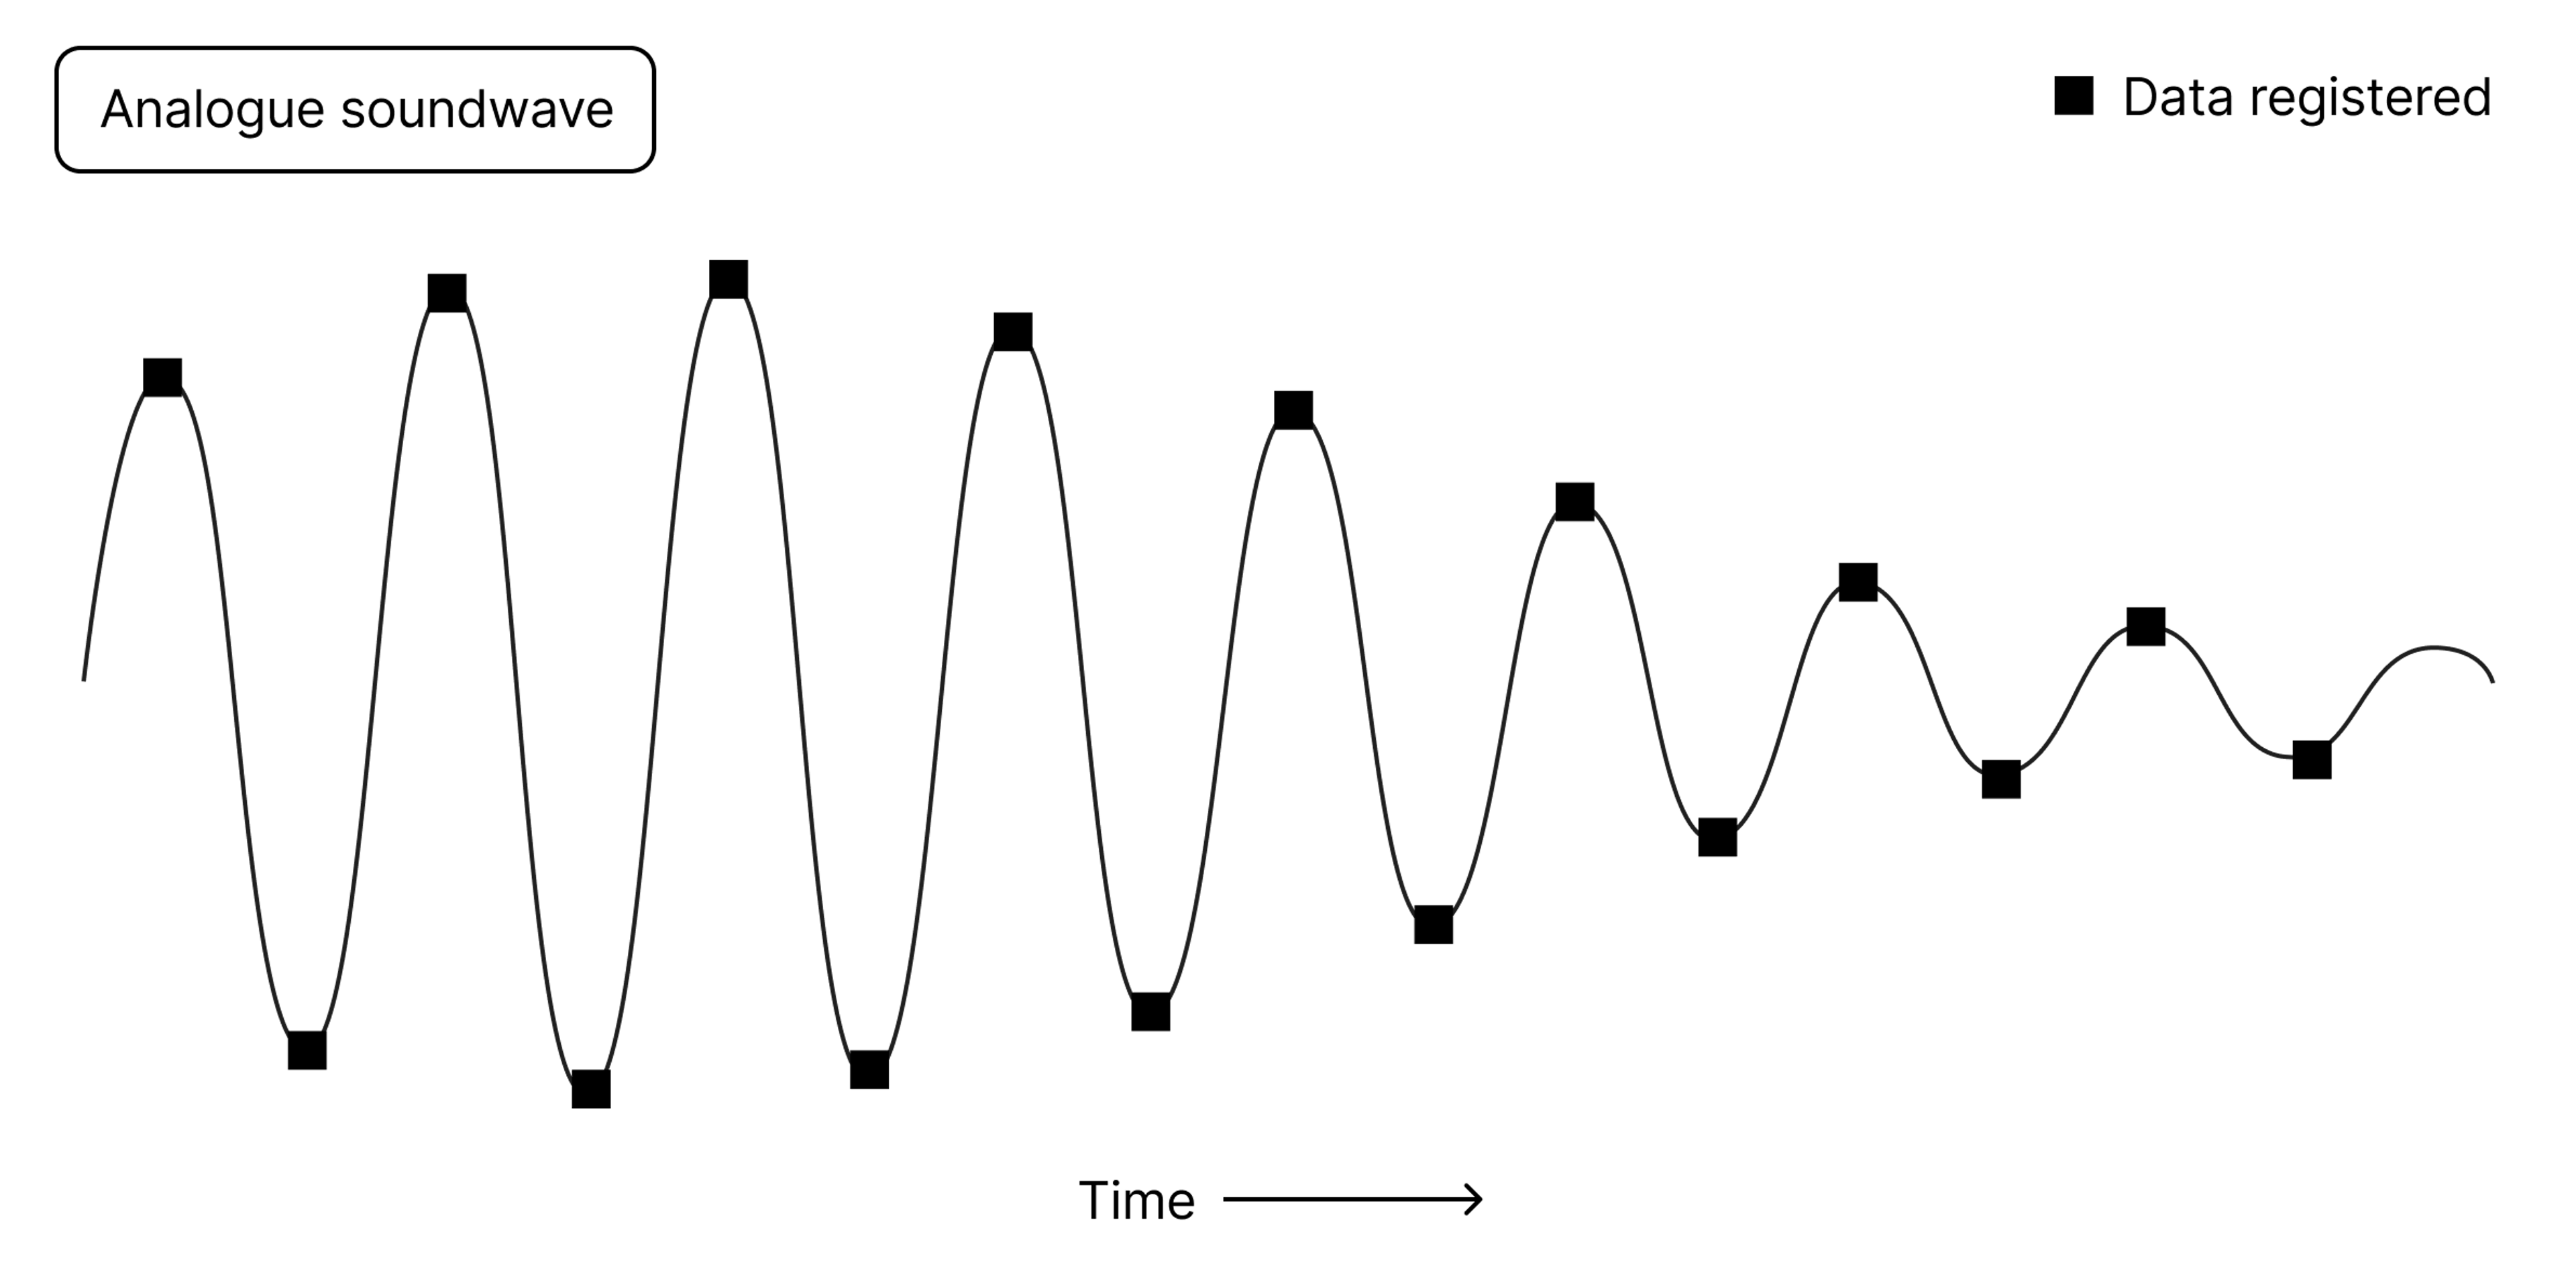
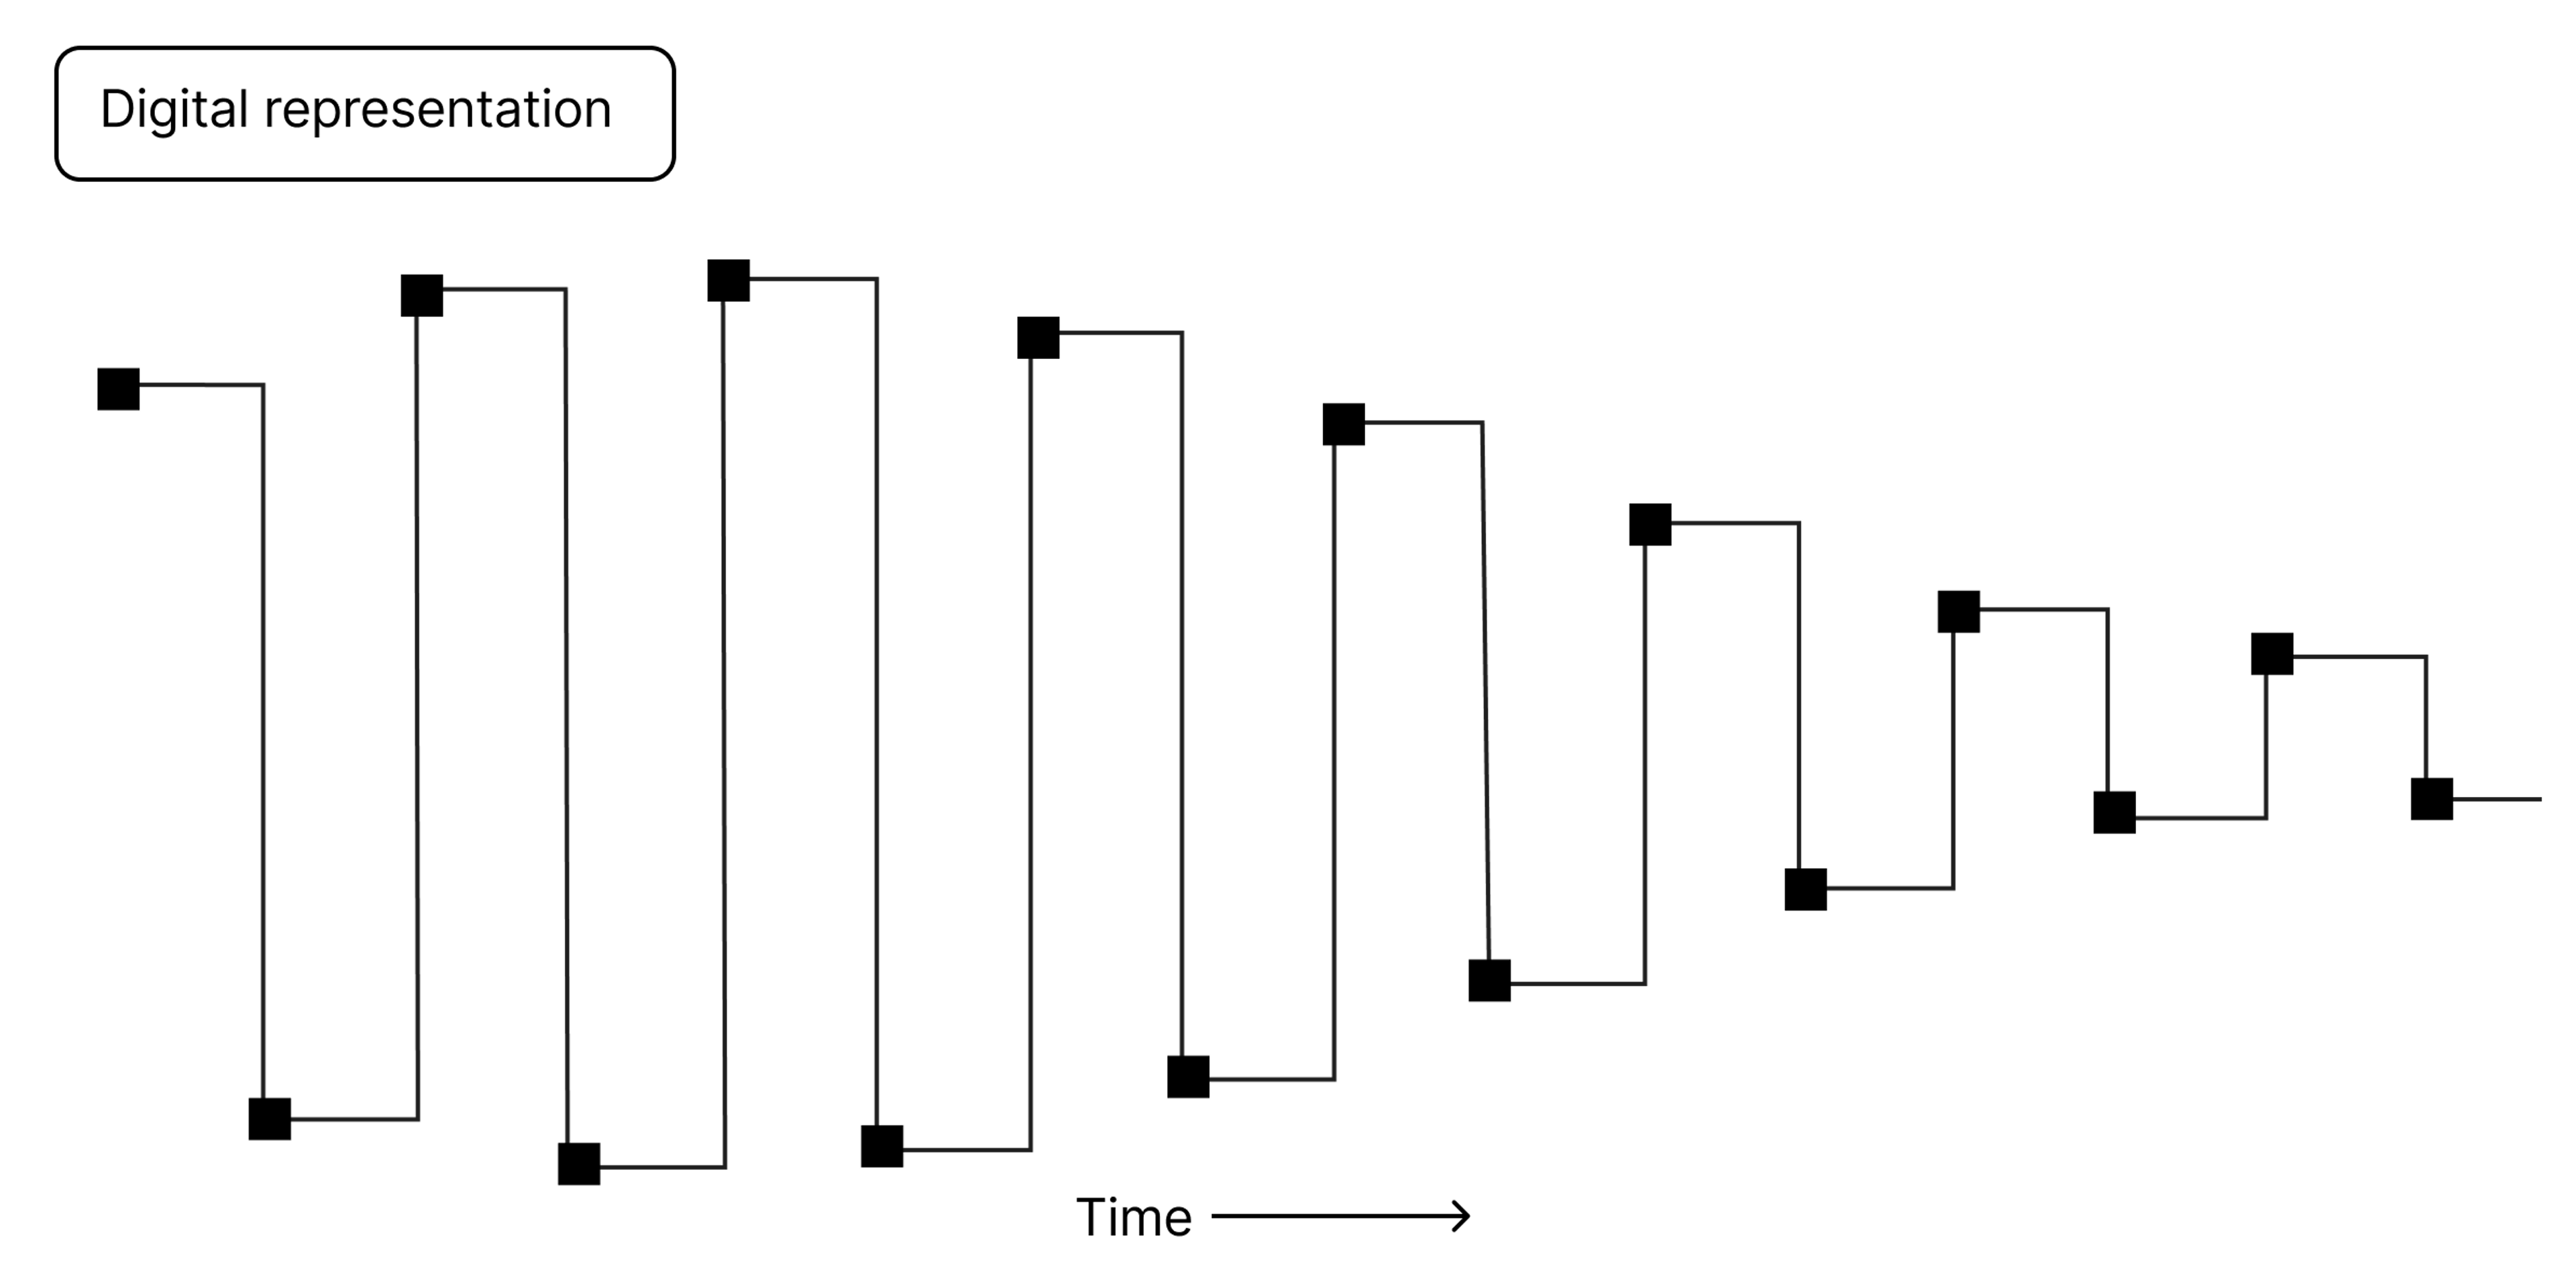
Above you see an example of how analogue data from sound—that is, sound waves—can be represented digitally in a computer.
Sound waves are analogue. We learned the definition of analogue earlier—the signal here is based on physical, continuously variable sizes. To translate this into a digital format, we must take samples at regular time intervals. The figure shows points where samples have been taken.
For an audio CD, a sample rate (frequency) of 44,100 samples per second (44.1 kilohertz, kHz) is common.
Another relevant factor for sound quality is how much information is captured each time the sound wave is read—that is, how many bits of data are stored for each of these 44,100 samples. A so-called bit depth of 8 or 16 bits is common, while hi-fi enthusiasts may prefer 24. And two channels are needed for stereo sound (one for each ear), which doubles the information content. (Hi-fi sound can take up several gigabytes of hard disk space per album—many billions of bits, in other words).
You can think of it this way: We measure sound waves in “two dimensions"—length/time and depth. That is, both how often it is sampled, and how much information is stored in each sample.
Streaming services like Spotify use algorithms to compress the sound, which means that there is typically less information content when you play music from Spotify than when it comes from a CD. While a CD will play 1,411 kilobits per second (Kbps), MP3 files and the music you stream typically have a so-called bitrate between 96 to 320 Kbps. But to truly appreciate the difference in sound quality, you need a trained ear and good equipment.
Image: From light to pixels

As we've seen in the example with sound waves, analogue signals must be represented digitally in the form of bits. The same is true for images. Fundamentally, images are also analogue signals—in the form of electromagnetic waves that our eyes (and camera sensors) perceive as light and colours.
And as is the case with sound waves, when we digitise images, we can also think in terms of two dimensions when determining the quality: Resolution (not unlike the “sample rate” of sound files) and bit depth.
By resolution, we mean the number of pixels/image points. A 24-megapixel photograph, for example, consists of 24 million pixels, while an 8-megapixel image consists of 8 million pixels. Thus, a 4K video (3840x2160 pixels) has four times as many pixels as an HD video (1920x1080 pixels).
Bit depth, on the other hand, is how many bits of data each individual pixel represents. The more bits, the more possible colours we can reproduce.
In the figure above, you see a simplified example of how pixels can be represented binary, i.e. digitally. Here, a 2-bit representation of each colour is used, which gives 2^2, or 4 possible colours.
A common digital image in jpg format uses 8 bits to represent each of the main colours red, green and blue (RGB). Altogether this gives 24 bits per pixel. This means 256 possible shades of each colour, and a total of 16.8 million colours when you combine them.
When you take pictures in raw format on a system camera, you can work with a bit depth of 12, 14 or 16 bits per channel. Just as the hi-fi enthusiast wants a larger bit depth and more information in the files, this gives photographers more colours and shades to work with.
Data at different levels
To emphasise what we have seen, data at its lowest level is one or more bits in combination. But we can also talk about data at a higher level, for example pixels in an image or characters in a character set. Or at an even higher level, where an image (made up of pixels) is data and a text (composed of characters/letters) is data.