Data Mining
At the beginning of the chapter, we spoke about digging for gold. That’s not far from the truth! Digging, or more accurately mining, is a big part of the process of making data valuable.
We’ve looked at databases, statistics, and machine learning. At the intersection of all these, we find data mining.
Data mining refers to techniques used to automatically analyse large data sets to look for patterns and to discover unknown features in a set of data. It can be used for anything from conducting market analyses to identify new product groups, predicting future trends, or uncovering security flaws in a network.
Data mining can be defined as the process of extracting information from a dataset, and then transforming it into an understandable structure for further use.
It probably goes without saying that data mining relies on automation and isn’t done manually.
In some cases, data mining is automated using machine learning, for example when dealing with unstructured data. In other cases, the job is done using software that has step-by-step instructions and rule-based (non-intelligent) algorithms, telling them what to look for.
We’ll soon go further into the techniques we use in data mining. Here, it’s important to note that these often overlap, and that two or more techniques are almost always combined to reach the goal.
There are, therefore, many techniques related to data mining. The ones we’ll look at here are these:
- Association / relation
- Classification
- Clustering
- Prediction
- Decision trees
- Text mining
- Social network analysis (SNA)
- Process mining
It may look a bit complicated, but it’s actually easier to understand than one might think! Let’s start from the top:
Association / relation
Associations (also called relation techniques) are about identifying relationships between variables: If we see A, can we expect to see B.
We can understand how association technique works by imagining how a doctor would make a diagnosis. First, she maps out the symptoms: Which related diseases can the doctor consider, and which can she rule out? Association is closely linked to statistical principles like probability.
Another example is this: Many customers in an online store have bought a laptop. The same customers have also bought a wireless mouse. Then the association technique will reveal a relationship between the variable laptop and the variable wireless mouse—two sets of data that had no relationship as pure data points. With this information, the online store can offer bundle deals with the computer and mouse.
These are simple examples that anyone could have thought of. But with data mining techniques, we can find associations and relations that are much less obvious. Maybe we find hitherto unknown relationships between disease and symptoms, which allows us to start earlier treatment.
Classification
We’ve already talked about classification in connection with machine learning. It’s about sorting data into predefined classes. This provides both a way to understand the data and to distinguish between them.
Although machine learning is often used for this, it can also be done with rule-based systems, which look for certain keywords, sizes, or properties to classify the data.
Clustering
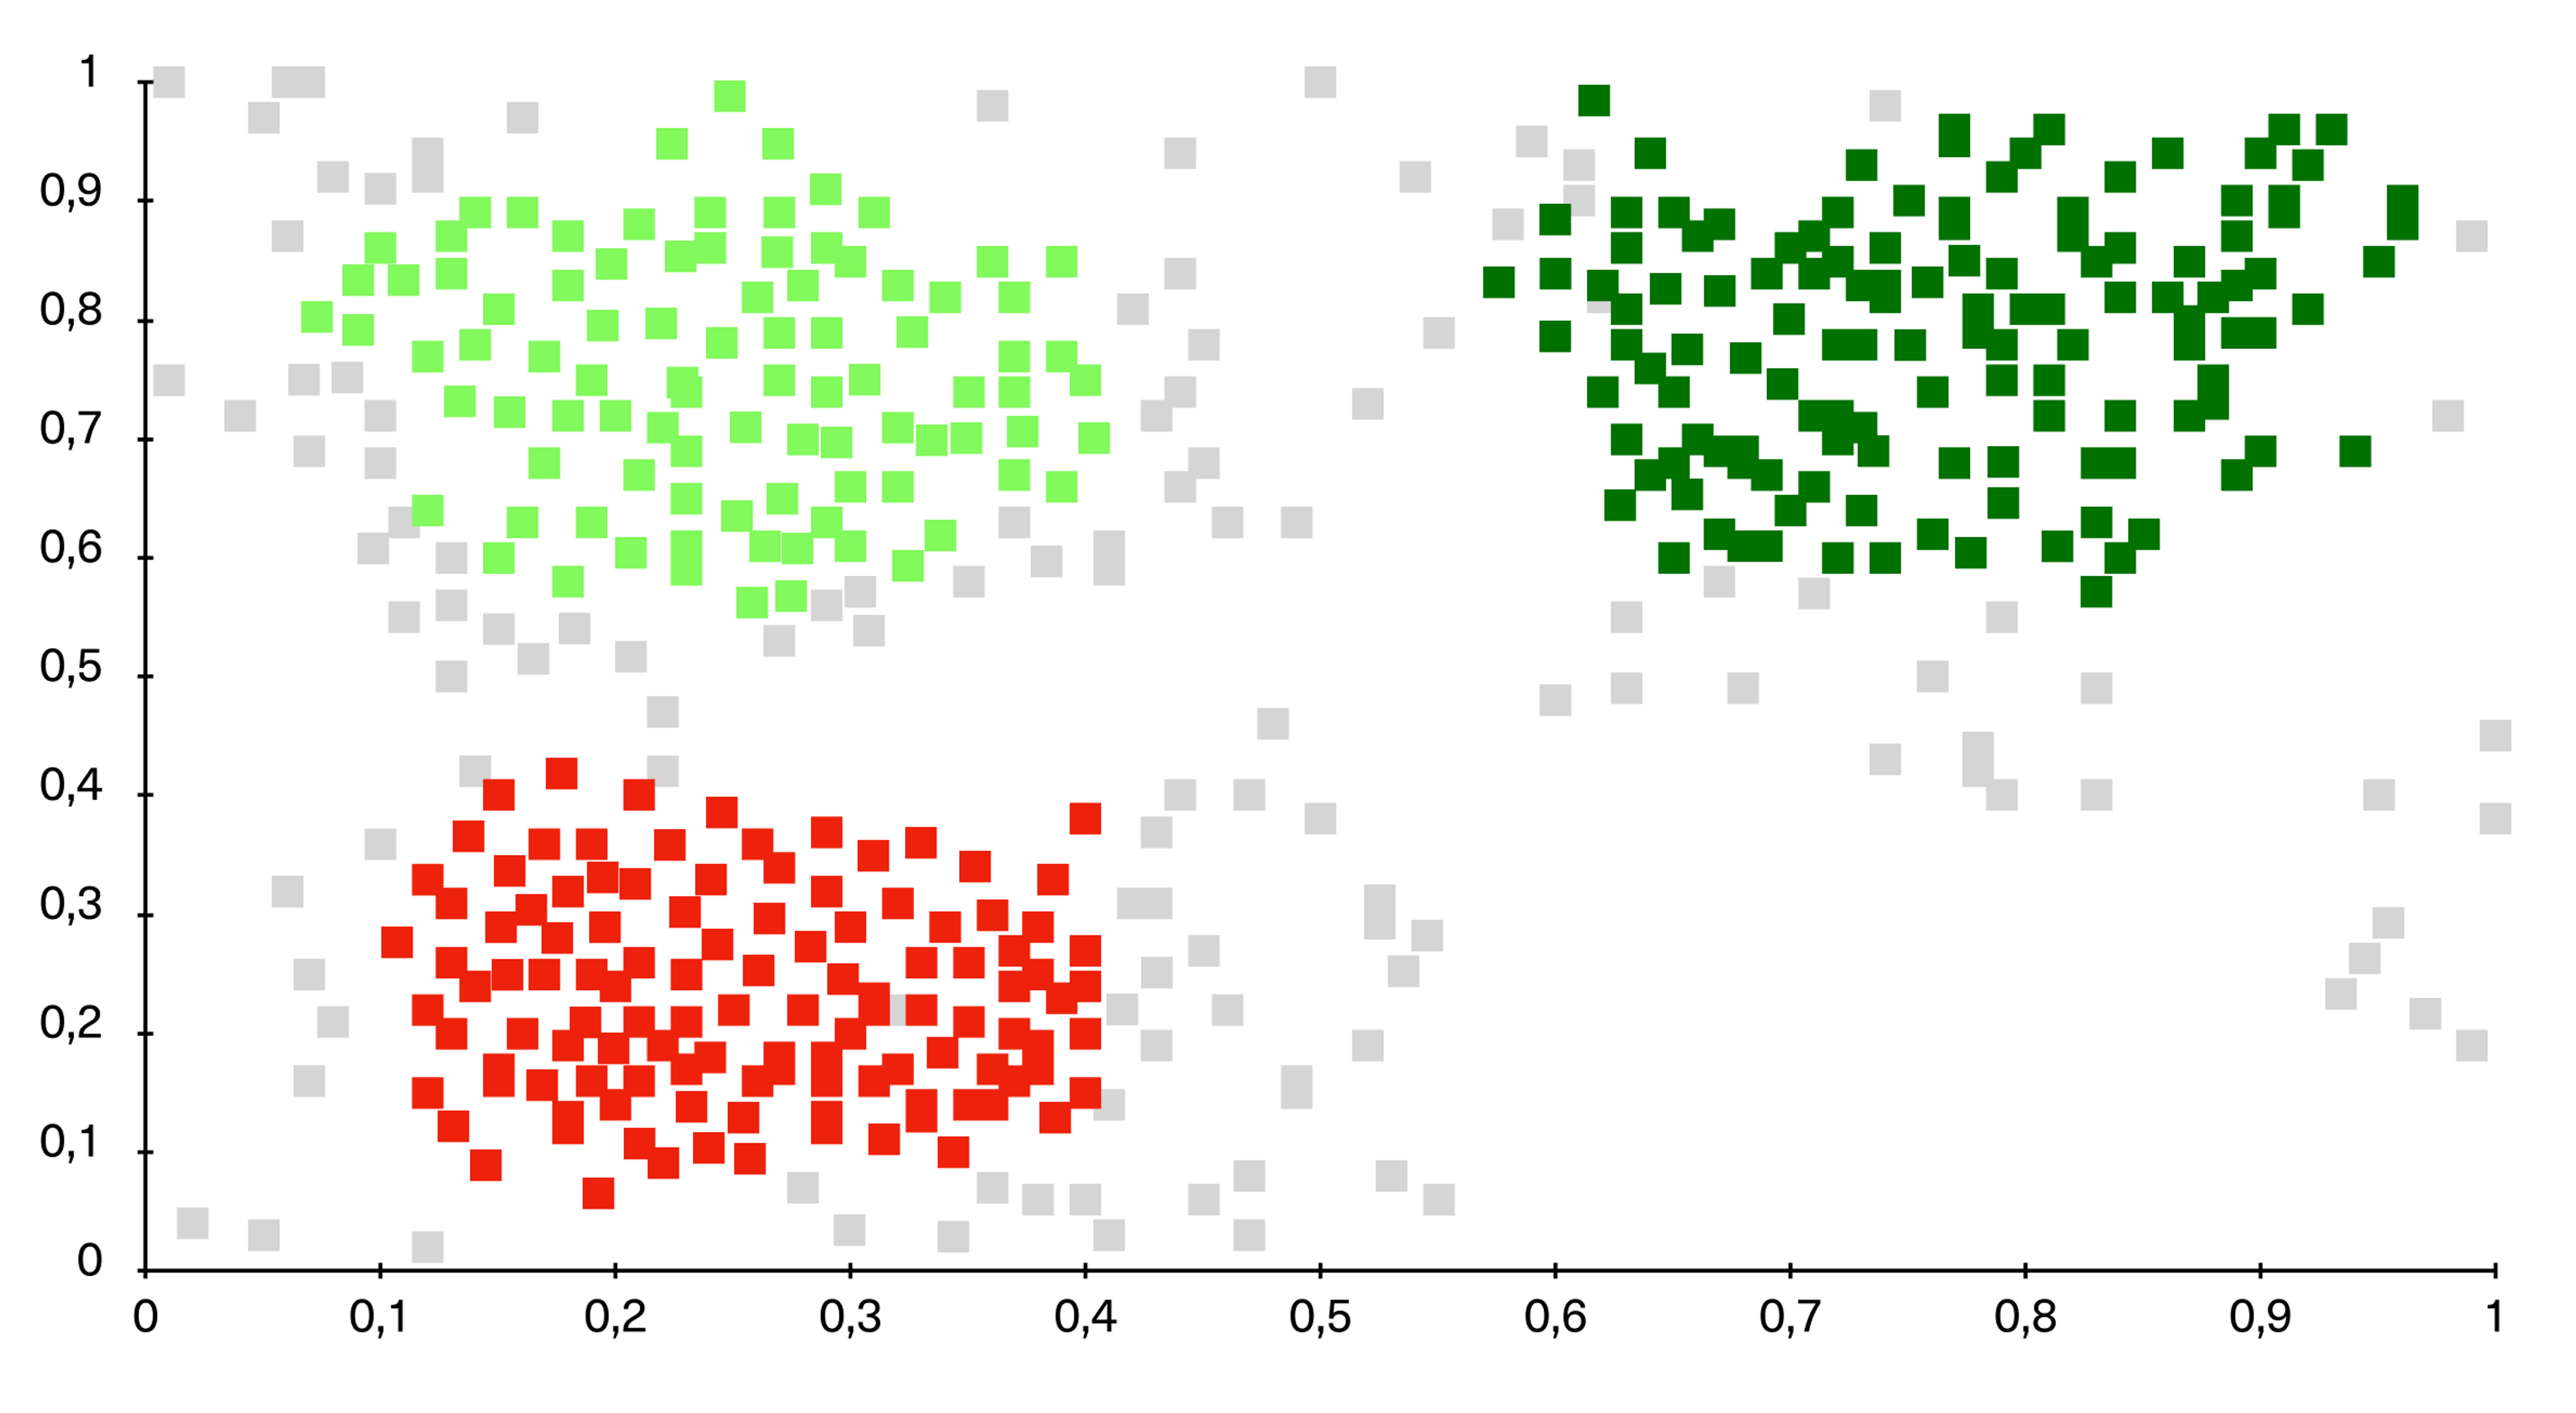
Clustering is about using one or more attributes as a basis for identifying a cluster of correlating results.
In a cluster, all the objects are related to each other.
Clusters are useful for identifying different information because it correlates with other examples—allowing you to see where similarities and areas align.

Prediction
Prediction can involve the analysis of trends, classification, pattern matching and relationships (of past events) to predict a future event. For example, predicting how much money a customer will spend, based on their income and profession. If we have information about previous customers, and see how they behaved, we can make a prediction about a new customer if we know their income and profession.
Decision trees
Decision trees are used either as part of the selection criteria or to support the use and selection of specific data within the overall structure.
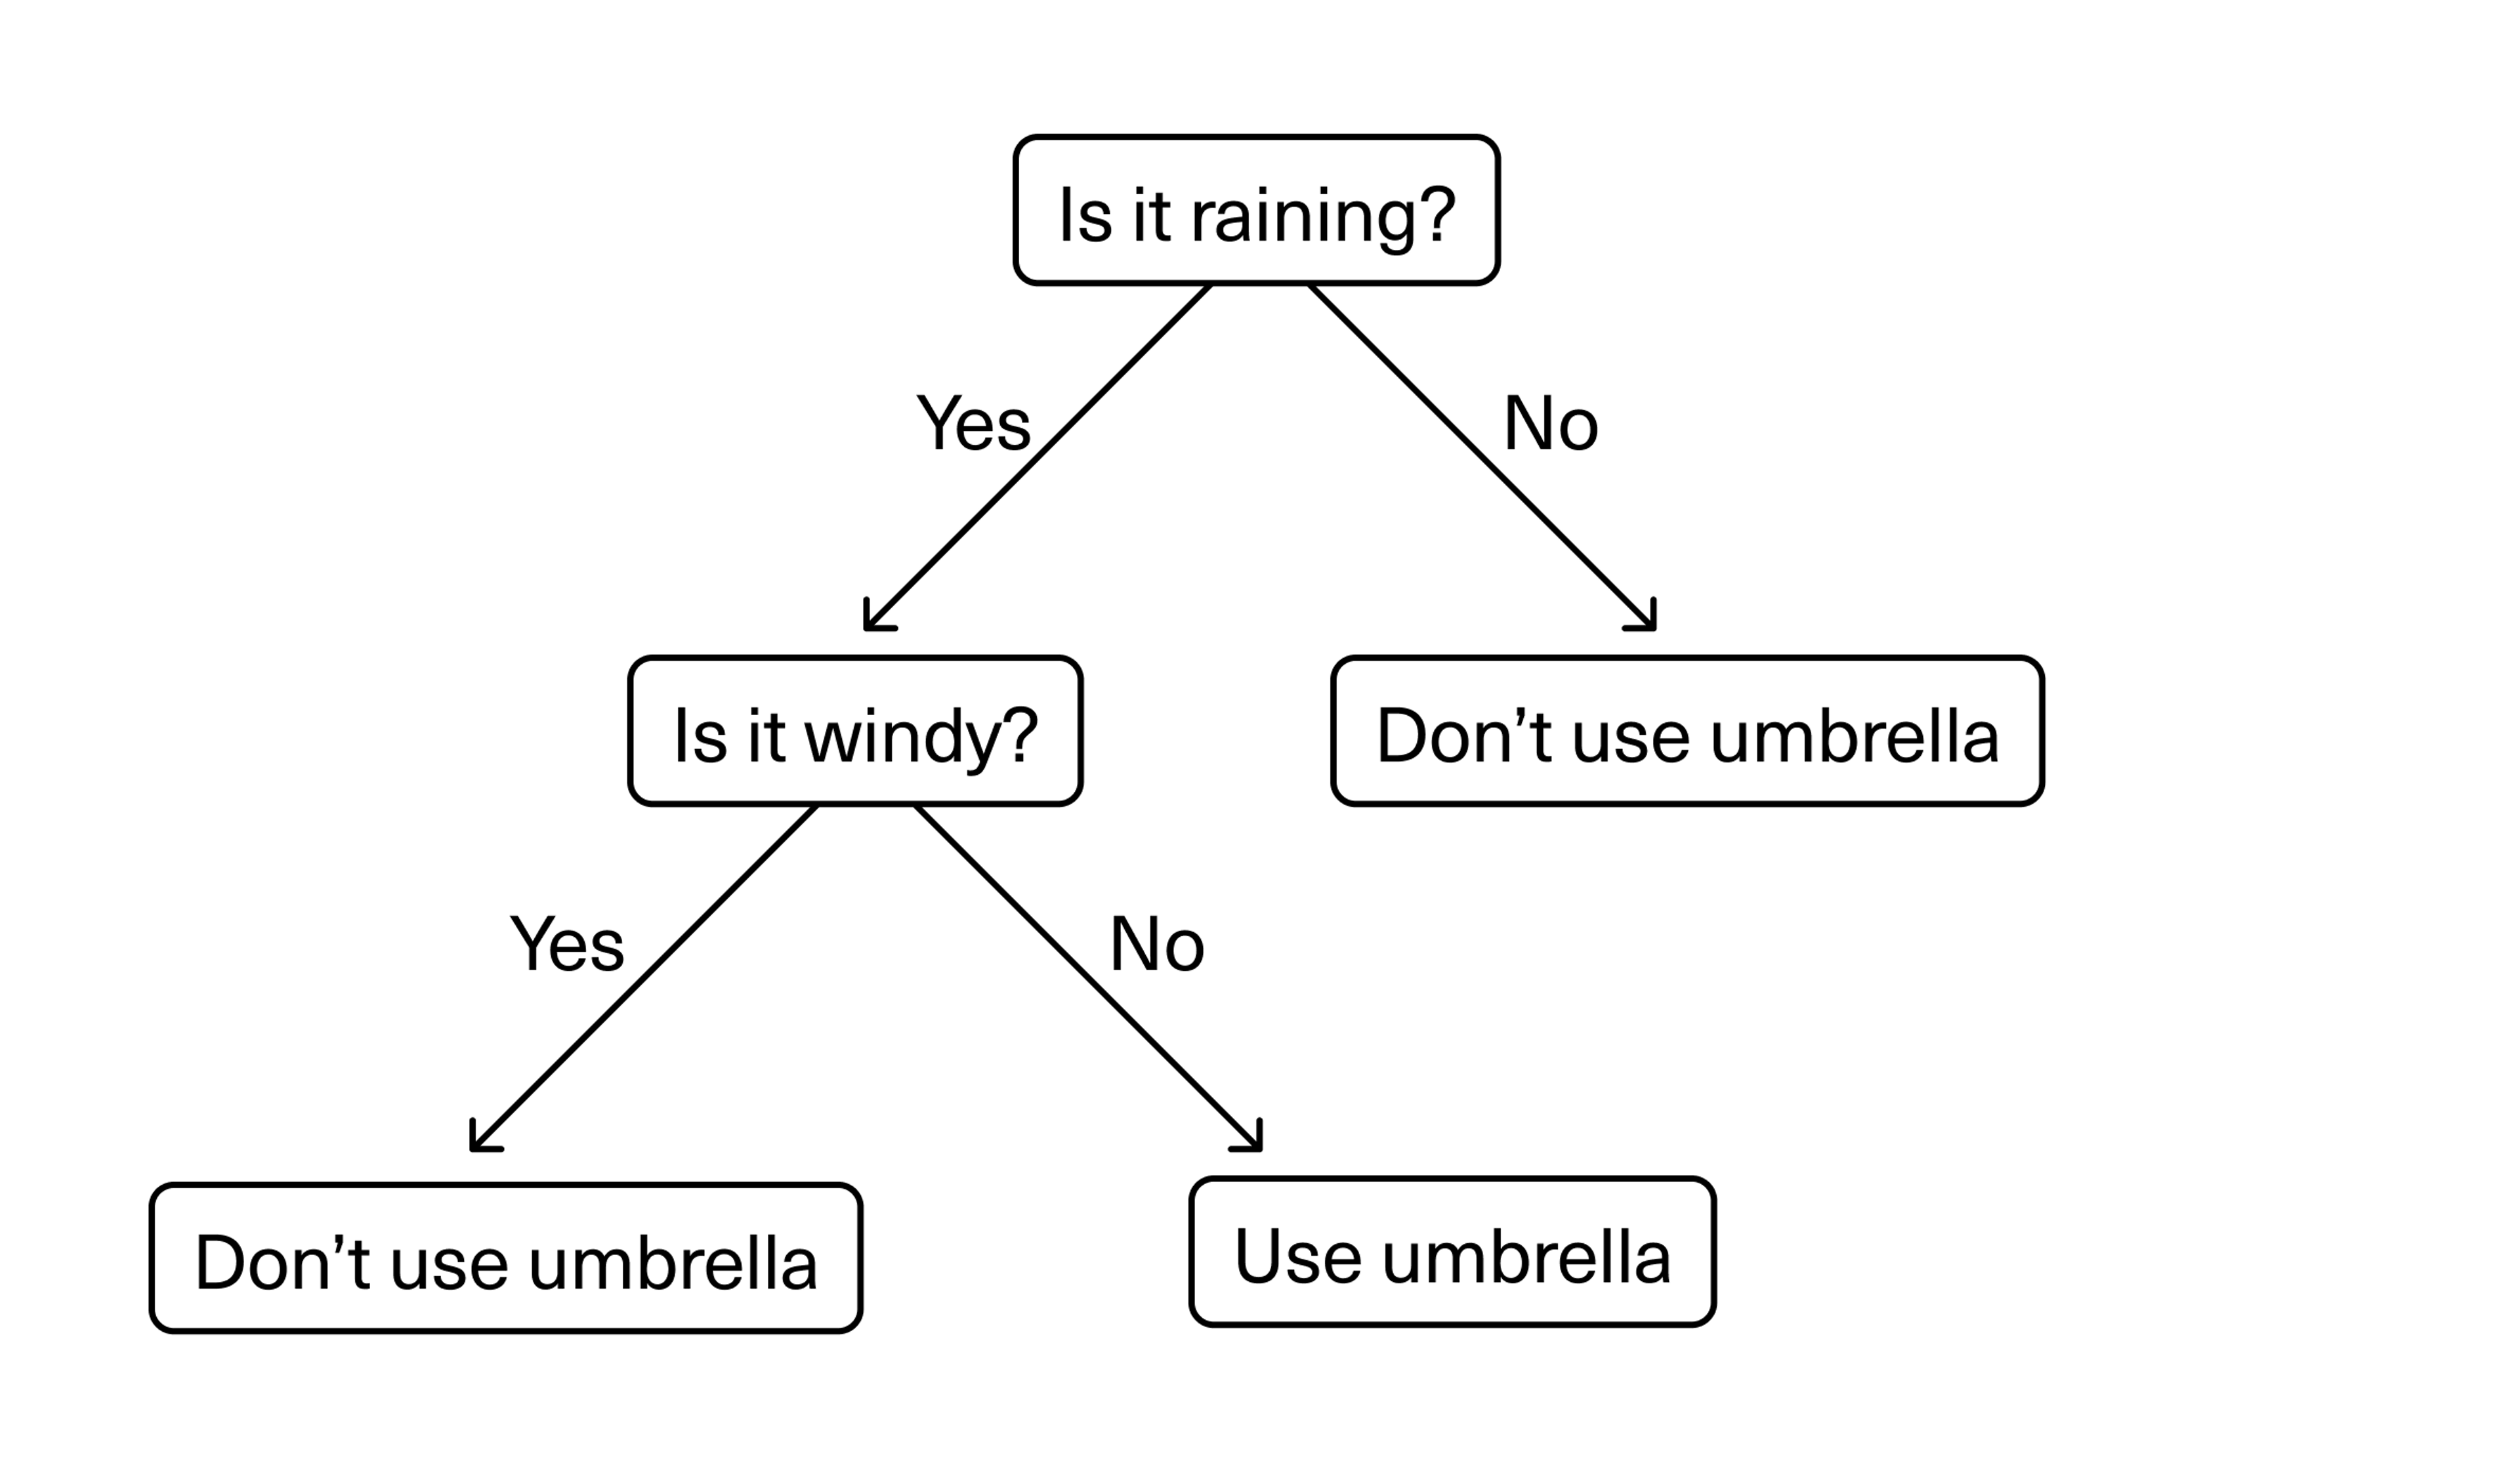
Often, we start with a simple question—for example: is it raining?—which has two or more answers. Each answer leads to a further question to help classify or identify the data so that it can be categorised, or so that a prediction can be made based on each answer.

The first question is whether it’s raining. If not, we can make a decision that we won’t use an umbrella. If yes, we can proceed to the next question: Is it windy? If not, we can use an umbrella. If yes, we might not want to use an umbrella—as it will get blown inside out and be ruined in the wind. Then we should use suitable waterproof clothing instead.
Text mining
The next method is “text mining”. This involves examining large amounts of text—for example, a selection of research literature—in search of insights about the language and content.
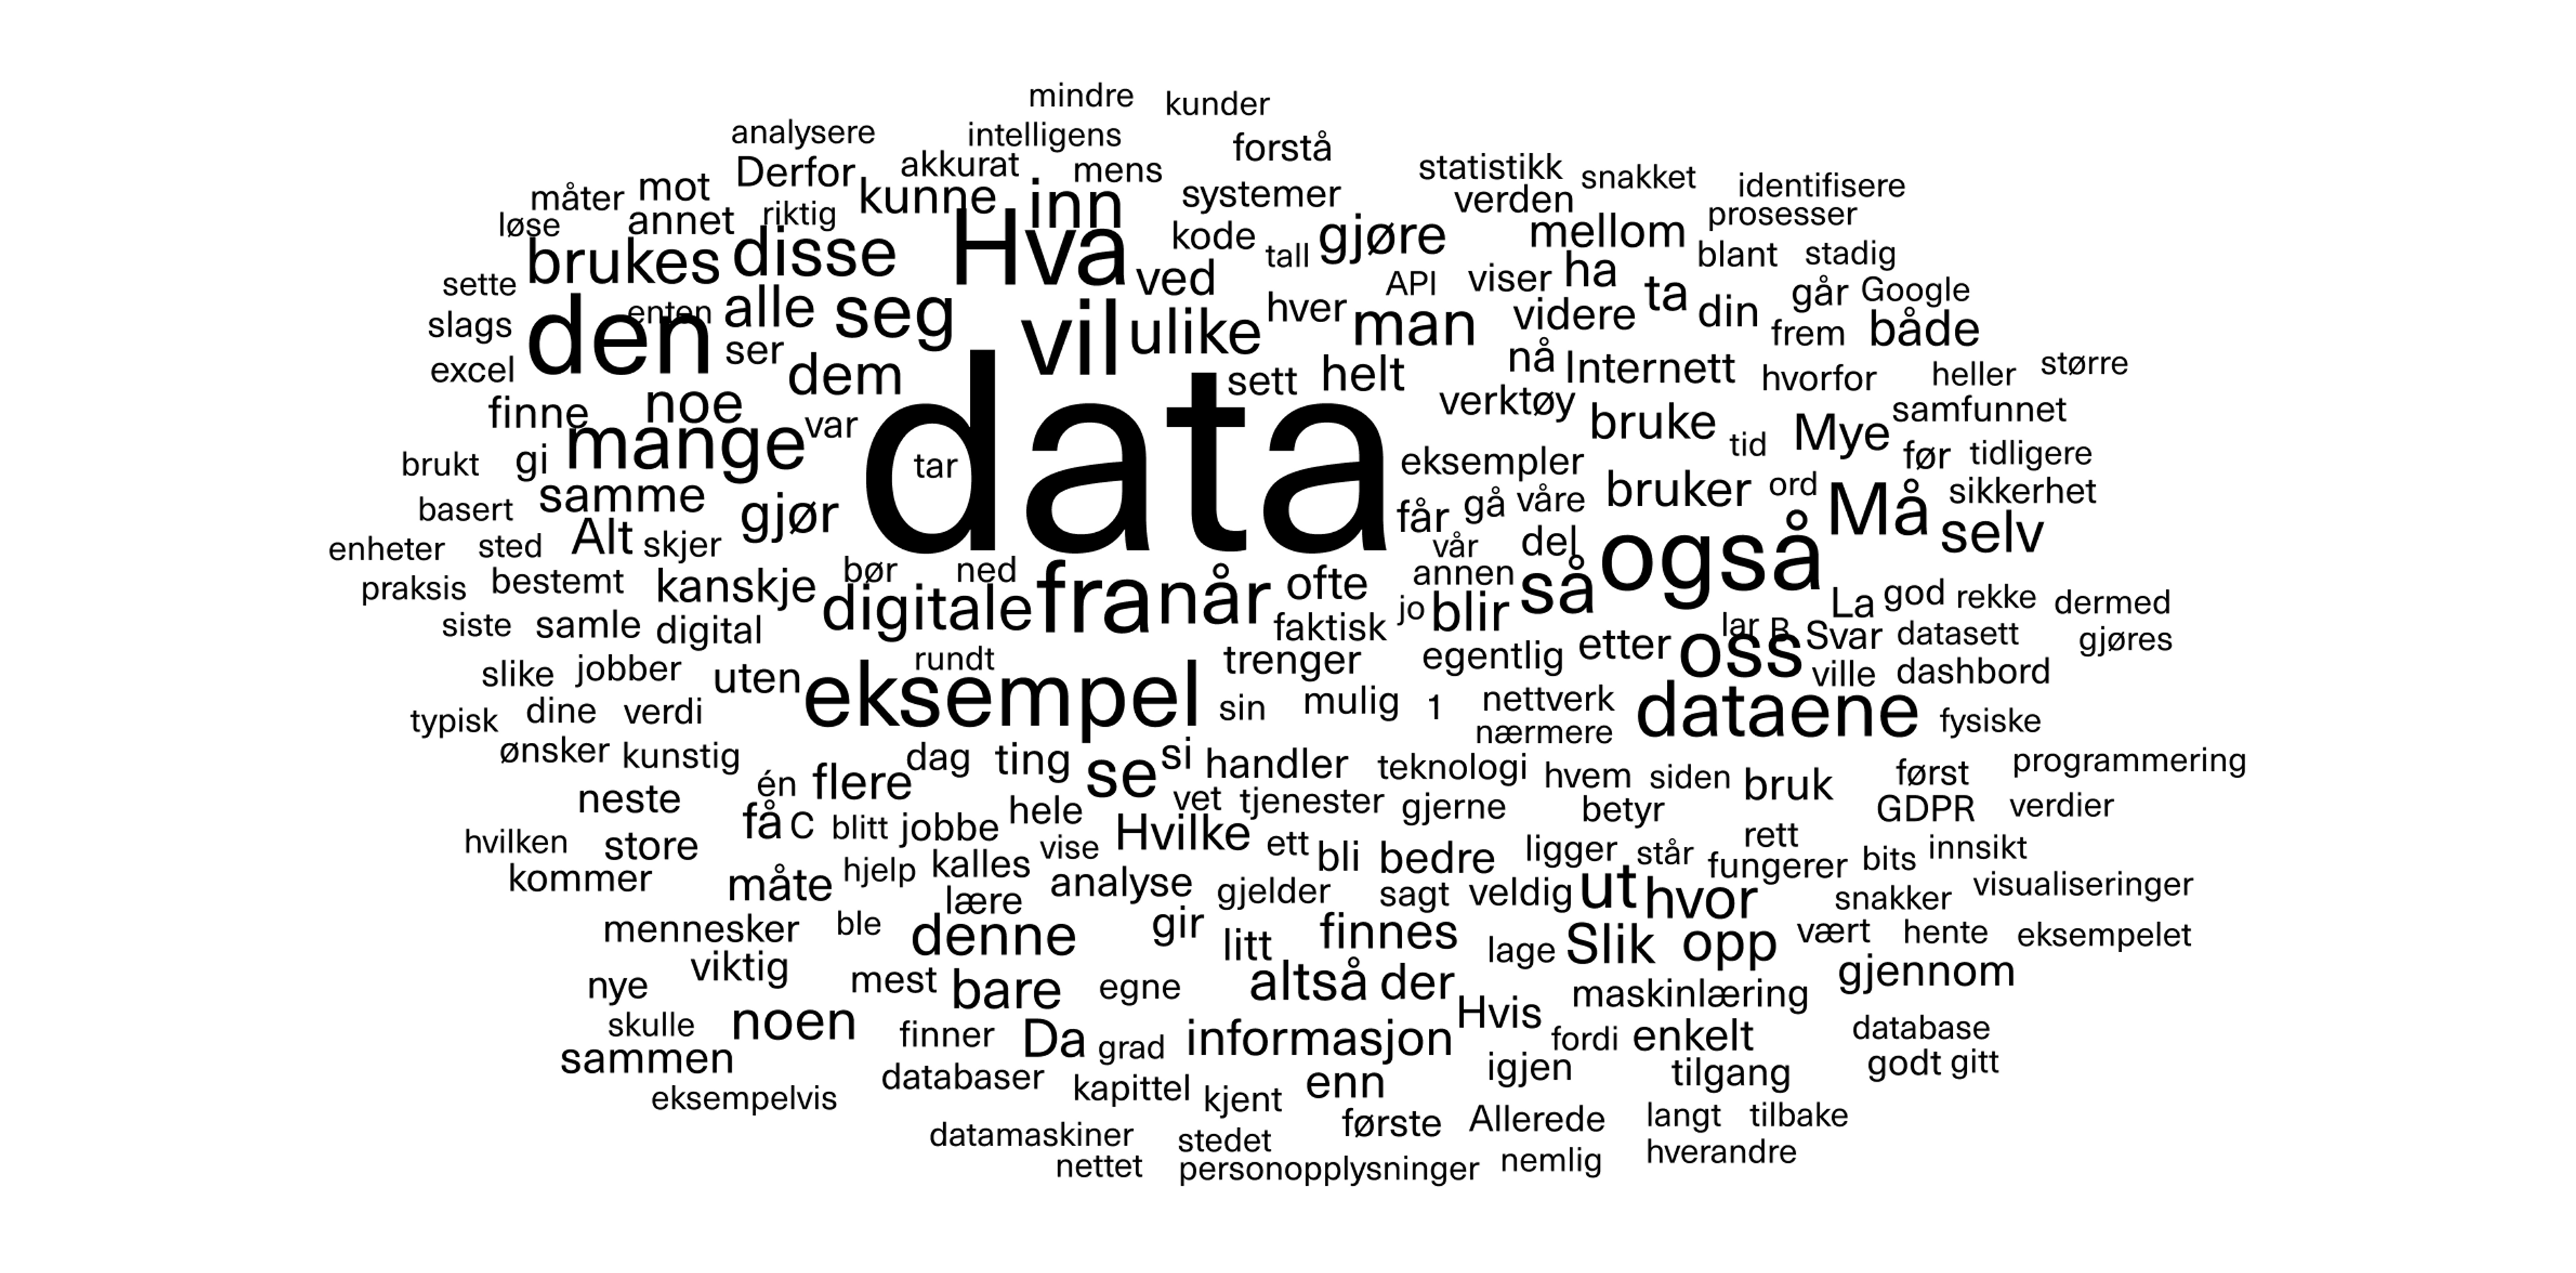
A simple example of this is a word cloud. Here, one can use tools that look at, for example, a set of research articles, and see which words are often used. One can then visualise these in a “cloud” where words become larger and clearer the more often they are used in the text.
This can tell us something about what these articles are about, what is important for the article authors to get across, and what kind of language is used. In the tools used to create such word clouds, you can choose to remove words such as ’a’, ’in’, ’on’ and so on, which are insignificant.

Social network analysis (SNA)
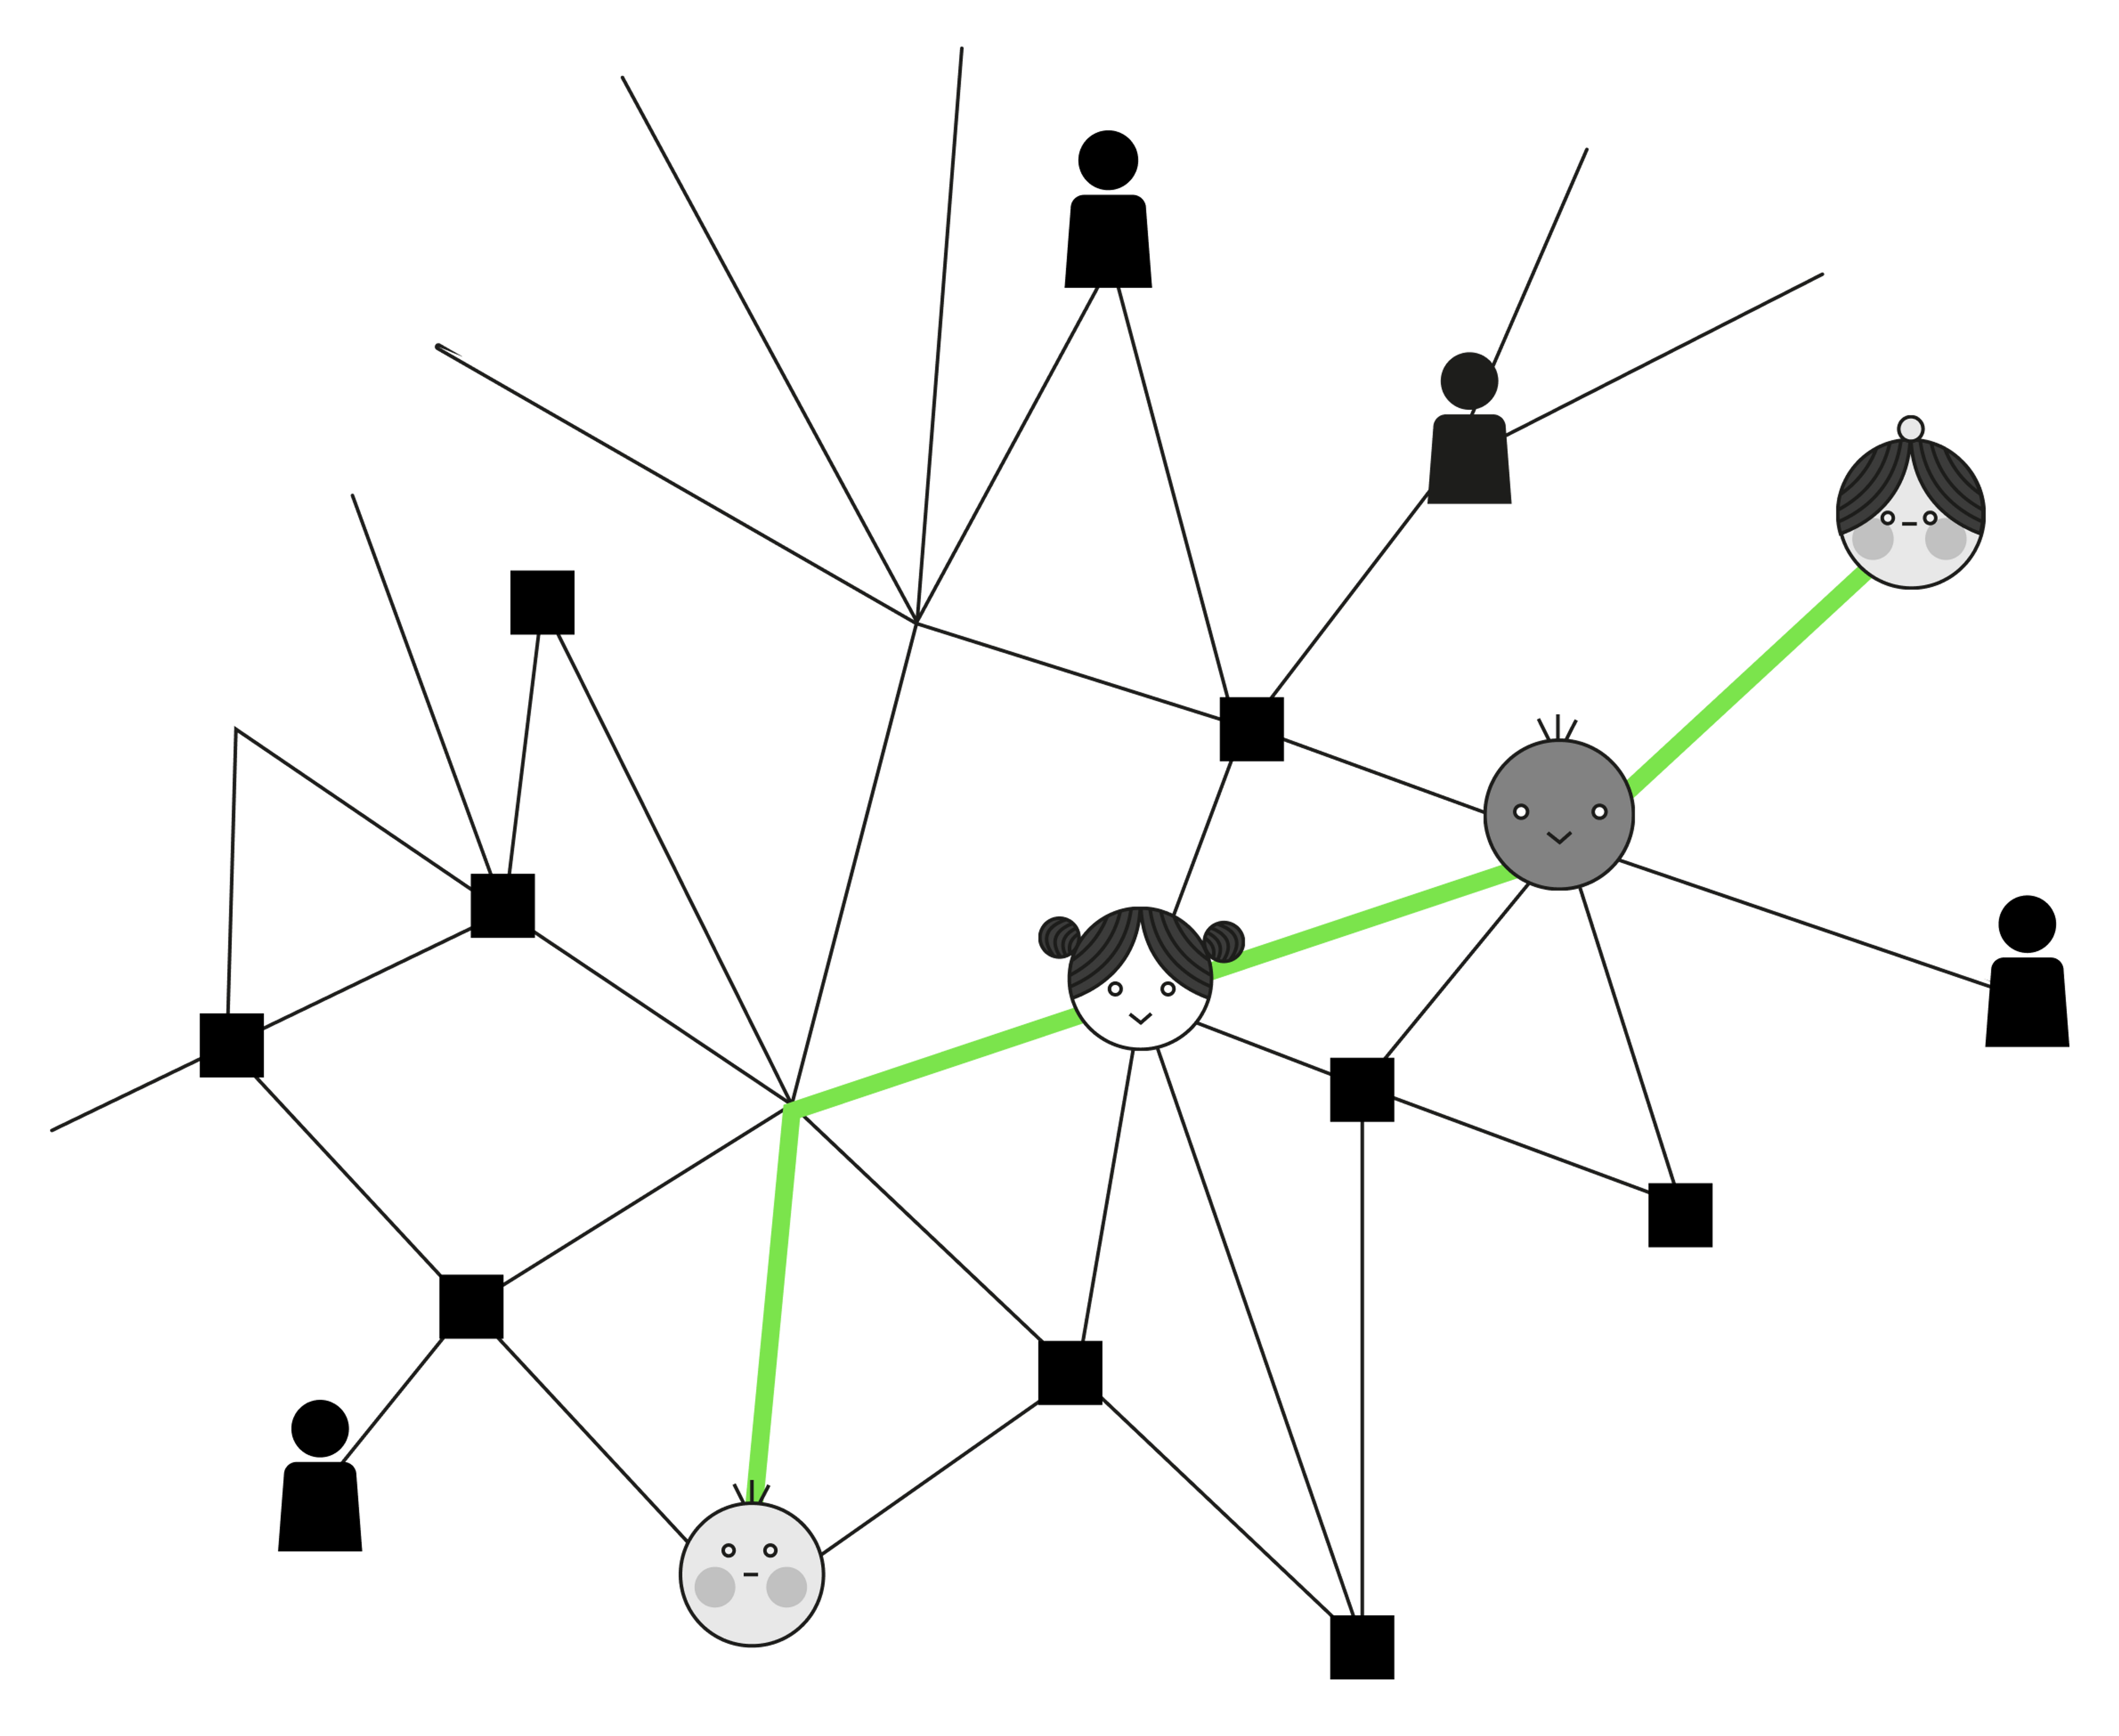
With social network analysis (SNA), we aim to understand a community by mapping the relationships connecting the community’s individuals as a network, and then try to highlight key individuals, groups within the network and/or associations between individuals.
Here we have a simple example where you see representations of different individuals and how they are connected to each other.

In a more complex network, various means such as different colours and sizes of the nodes (junction points) and lines are used to make the different relationships as clear as possible.
Network analysis can also be used to see relationships between other types of nodes—for example, topics in a discussion forum, as in the illustration above. The slightly larger nodes are the most discussed topics. They can be given different colours according to the type of topic, and be linked to each other if they are similar or overlap—for example, if the same references are repeated.
Process mining
Process mining, or PM as it is often called, is a method of analysing event logs to identify trends and patterns.
One of the most popular types is what is known as sequential pattern mining, where we seek to find connections between occurrences of sequential events, such as tracking action patterns in a grocery store.
For instance, you can identify that customers buy a certain collection of products together at different times of the year—like a really good coffee, chocolate, and an advent calendar. Then the store can create a package with these kinds of products and try to get even better sales.
By breaking it down and looking at which actions are often connected, we can create what is called a process model. Here we can see that A tends to lead to B, but then it branches out, for example, and one goes on either to C or D, and then perhaps D repeats twice, and so on.
The final process model can be used by a business to investigate whether a particular process is as they want it, or whether they can improve it or make changes. Perhaps one discovers, for example, that a certain process does not flow as well as it should. Then one might want to make changes and create a new model. In this way, the method can be used to find and improve processes in a business.